Linux Process management for developers
Once in a while we all have to deal with rogue/stuck process in linux environments. I never had a clear idea to how to
figure out root cause of the issue, I always did kill -9 and restart the process. But the day I started
working on Devops, I’ve had no choice but to investigate such issues, figure out underlying cause and fix it. Typically
a developer is concerned with creating technical components where as a devop guy have to make sure that component is up
and running, if not then why, what needs to be done about it. Managing linux process can be very interesting and
essential skill for a developer as well.
We are going to use 2 tools(journalctl, systemctl) extensively for this purpose, these tools are part of a
package called systemd, make sure systemd is installed in your distro if not install it. Use yum or apt-get to
install.
Process, are you alive ?
Use ps aux to see if a process is running or not,
ps aux | grep process_name
ps aux will give you all process running on machine, then you can pipe result to grep utility to do a filter on
top of that.
If the process is still running you get to see a line with PID, owner and name of process. In this example, I’m
checking if rails server is running.
 PS: Do not confuse the second line as a process, it’s listing
 grep tool which we used to filter the result.
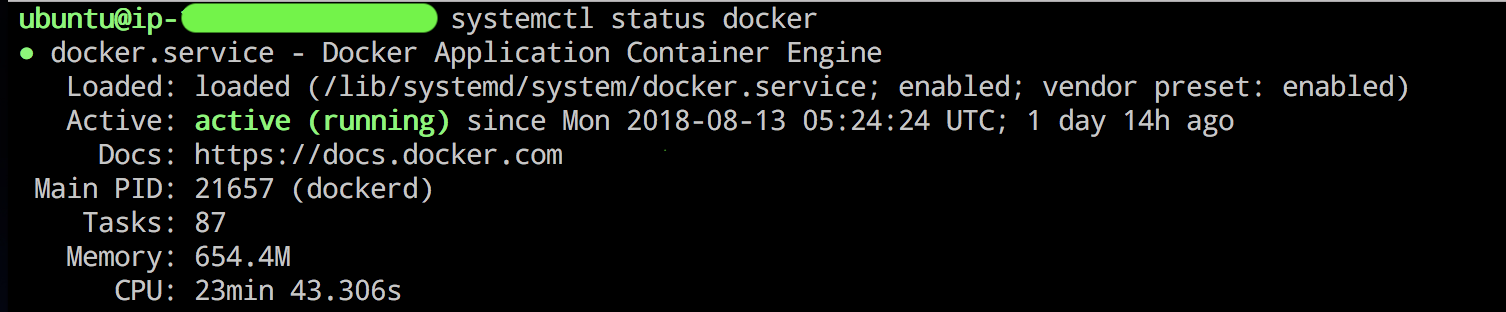
Alternatively, we can use systemctl tool to check status of a process. It shows Status of the process, memory used
etc. It’s more of an eye candy than ps aux, systemctl may not show status for all process, so use
ps aux if systemctl is not showing.
To check status of a process, use systemctl status process_name
It’s all in the logs !
In an event of process getting unresponsive/stuck/killed, it might leave some clues in logs what caused it to go rogue. Unfortunately we have couple of logs to monitor instead of one single file, these are usually,
- Process specific application log, eg.
/var/log/nginx/error.log - Standard Output(STDOUT) of process
- Standard Error(STDERR) of process
- Syslogs
- Kernal log messages(dmesg)
Since it’s a pain to keep an eye on all of these places, we can use a wonderful tool called journalctl which
shows all logs(except application logs) from these streams in a single view with customizable filters. journalctl is
a tool which reads from a log database Journal which contains logs from mentioned streams.
We can even watch logs in realtime with this tool, so if some process goes rogue, check logs with journalctl.
- To monitor logs real time, use
journalctl -f -
To show only relevant process related logs, use
journalctl -u service_name
There can be n number of reasons for a process to go haywire, it can be because of wrong config, low disk space or
process got OOMed(Out of memory). Once you’ve resolved the issue, you can either start the process with binary or use
systemctl start process_name.
Bonus points
-
To check if system have enough memory,
free -mh -
To see free and used disk space,
df -h -
To restart a process,
systemctl restart process_name -
To stop a process,
systemctl stop process_name -
To forcefully kill a process (Not recommended as it may corrupt files),
systemctl kill -f process_nameorkill -9 PID(SendsSIGKILLsignal and immediately stop process) -
To get the list of OOMed processes,
dmesg | egrep -i 'killed process'
Resources